
Coinmarketcap.com is without a doubt the most popular cryptocurrency price tracking website. I’ve often wondered if its elegant bitcoin prices table could be reproduced with phpGrid. That is exactly what we are about to do today!
The table includes crypto pricing statistics as well as sparkline chart based on real-time data from the backend server. It’s a proof of concept to show how far phpGrid can be pushed before I have to resort to other tools and frameworks.
Setup
Acquire the full version of phpGrid. The free Lite version is not compatible with this tutorial.
Follow these steps to install:
- Extract download file,
- Upload the phpGrid folder to web server,
- Complete the installation by configuring conf.php file.
For demo purpose, conf.php, set all database values to blank since our project doesn’t require a database.
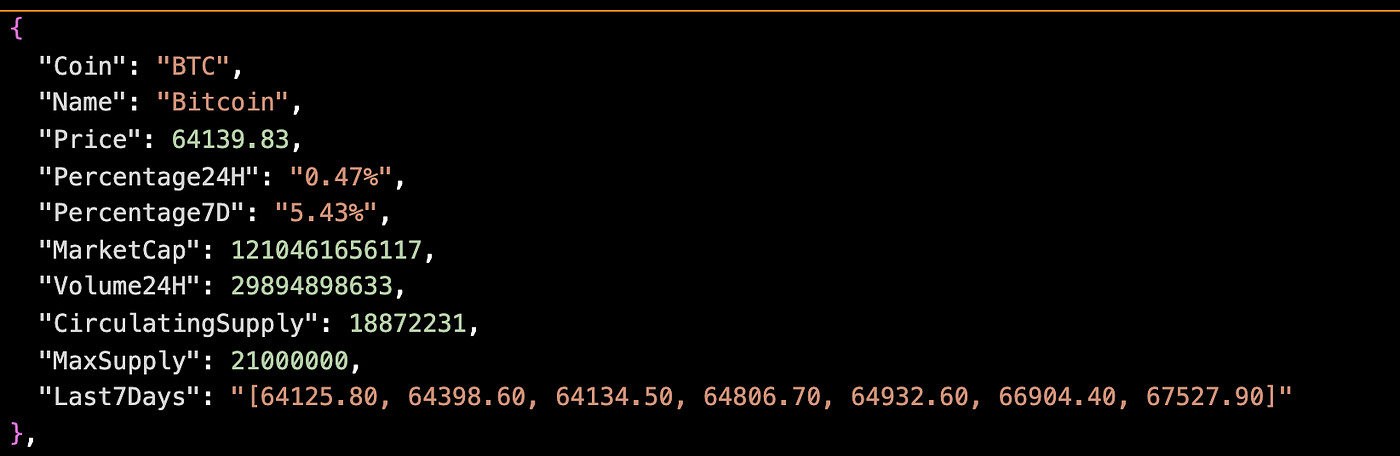
Sample JSON
The first step is to obtain a crypto data feed. Though it may be automatically retrieved from places like Binance or FTX.US, I decided to start with a local JSON data source for simplicity’s sake.
JSON sample
We’ll use this top 10 crypto sample to populate our CoinMarketCap clone.
Index.php
Let’s create index.php with the following:
1 2 3 4 5 6 7 | require_once("phpGrid/conf.php"); $url = "data/coinmarket_top10.json"; $data = file_get_contents($url); $json_output = json_decode($data, true); $dg = new C_DataGrid($json_output, "id", "CoinMarket"); $dg -> display(); |
$json_output is the sample JSON data source save in data folder. It is passed to C_DataGrid as the first parameter. It should display a very rudimentary grid similar to the following.
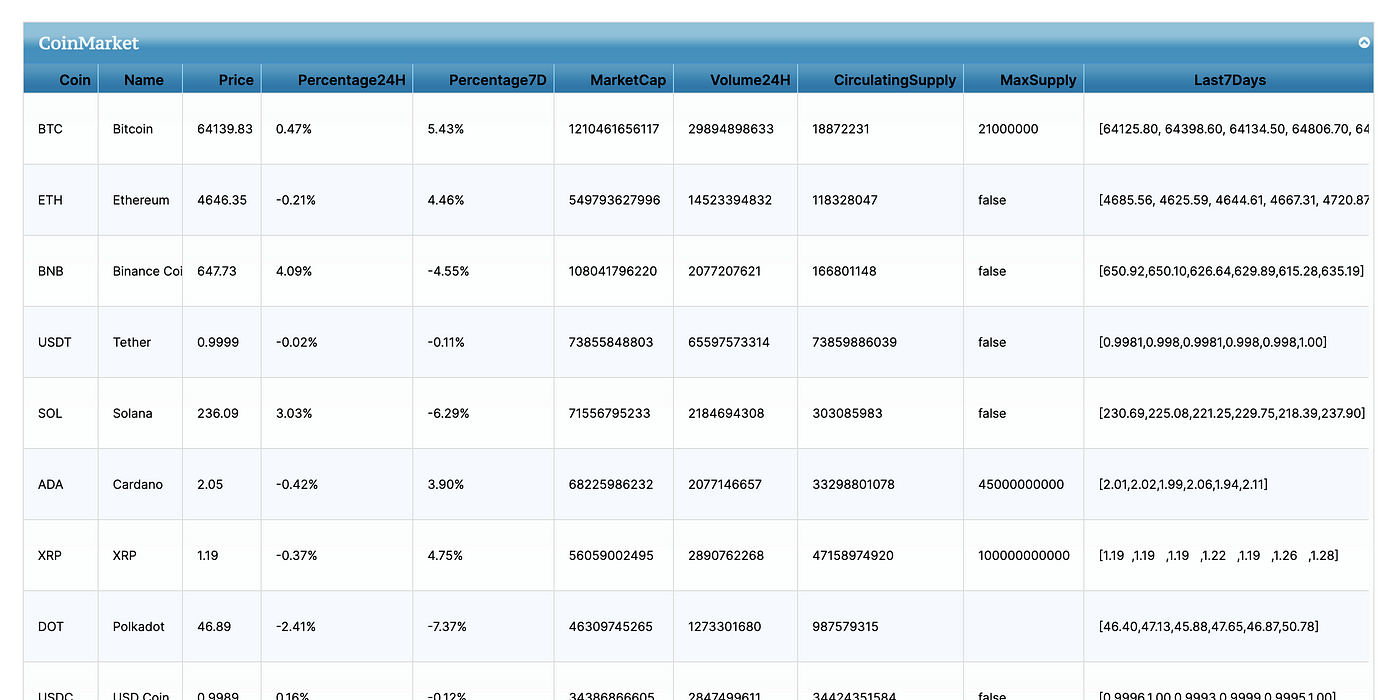
JSON as data source is covered in this tutorial.
I’ll confess, this is still a long way from what I’d like to accomplish. Let’s make some changes to the user interface.
Update User Interface
First by adding descriptive column title,
1 2 3 4 5 6 | $dg->set_col_title(‘<strong>Percentage24H</strong>’, ‘24h %’); $dg->set_col_title(‘<strong>Percentage7D</strong>’, ‘7d %’); $dg->set_col_title(‘<strong>MarketCap</strong>’, ‘Market Cap’); $dg->set_col_title(‘<strong>Volume24H</strong>’, ‘Volume(24h)’); $dg->set_col_title(‘<strong>CirculatingSupply</strong>’, ‘Circulating Supply’); $dg->set_col_title(‘<strong>Last7Days</strong>’, ‘Last 7 Days’); |
Hide non-display columns,
1 2 | $dg->set_col_hidden("Coin”); $dg->set_col_hidden("MaxSupply”); |
Fix text alignment,
1 2 3 4 5 6 | $dg->set_col_align(‘Price’, ‘right’); $dg->set_col_align(‘Percentage24H’, ‘right’); $dg->set_col_align(‘Percentage7D’, ‘right’); $dg->set_col_align(‘MarketCap’, ‘right’); $dg->set_col_align(‘Volume24H’, ‘right’); $dg->set_col_align(‘CirculatingSupply’, ‘right’); |
Update money format
1 2 3 4 | $dg->set_col_currency('Price', '$'); $dg->set_col_currency('MarketCap', '$'); $dg->set_col_currency('Volume24H', '$'); $dg->set_col_currency('CirculatingSupply', ''); |
Add row color and hover effect
1 | $dg -> set_row_color(‘white’, ‘white’, ‘white’); |
Fix column sort
1 2 3 4 | $dg->set_col_property("Price”, array("sorttype”=>"currency")); $dg->set_col_property("MarketCap”, array("sorttype”=>"currency")); $dg->set_col_property("Volume24H”, array("sorttype”=>"currency")); $dg->set_col_property("CirculatingSupply”, array("sorttype”=>"integer")); |
Add responsive width to screen size
1 | $dg-> enable_autowidth(true); |
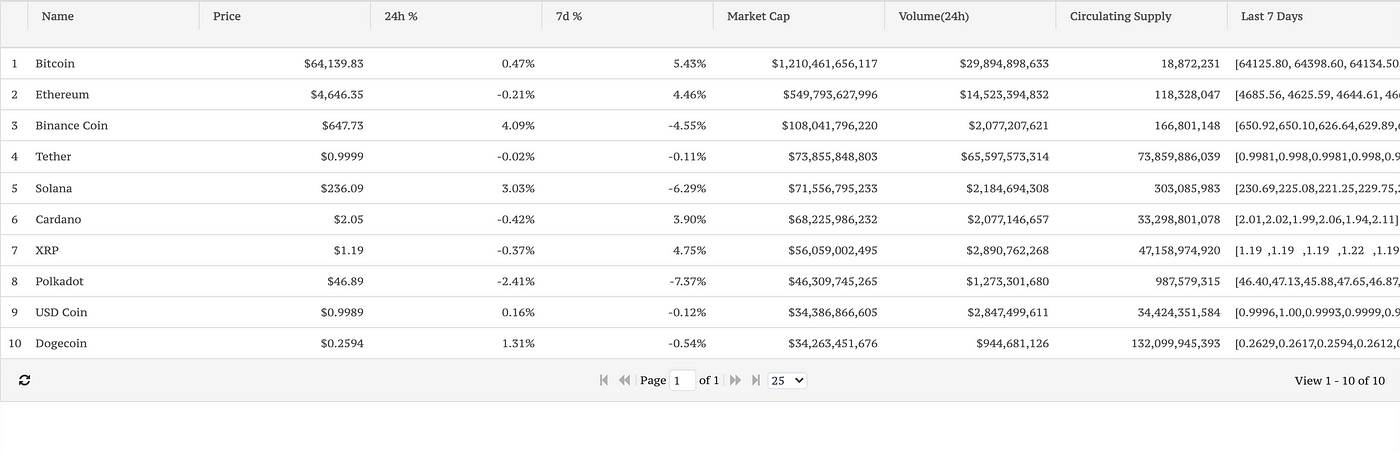
Finally some misc. style tweaks
Already look better! But it’s still not quite what I was looking for.
Adding Cascading Style Sheets (app.css)
I use a Chrome extension “What Font” to find out the font it used on CoinMarketCap. It is a free font from Google Fonts called “Inter”. Here are the embed links:
Then I made a few adjustments with some additional custom styles so I could “perfectly” match the look (almost)
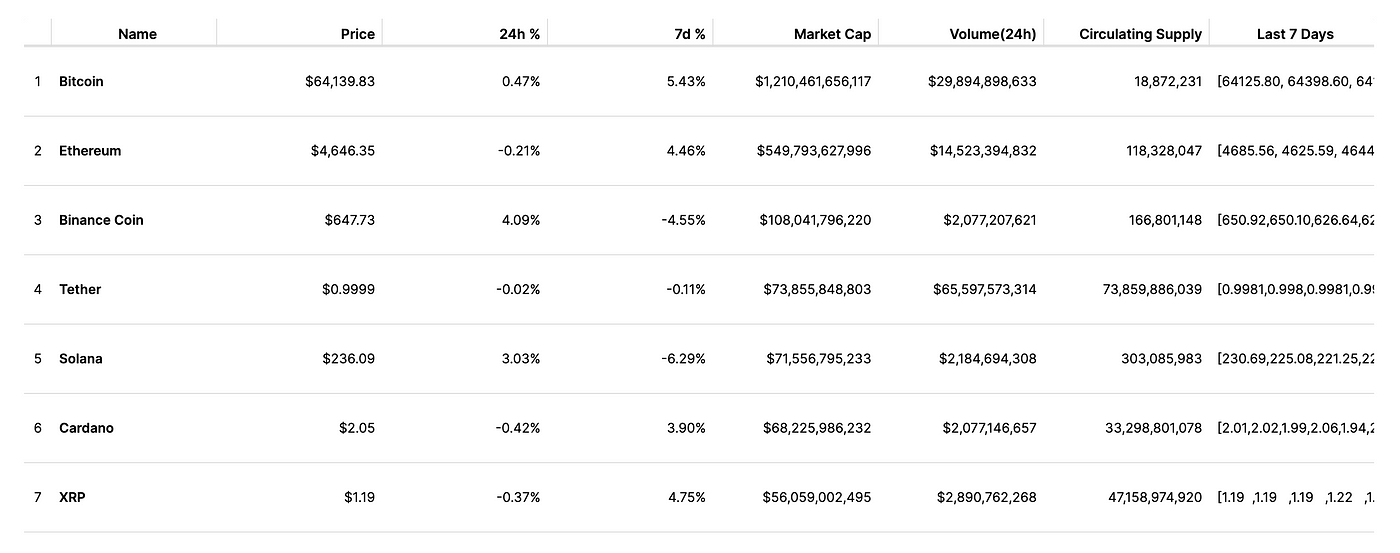
It looked better but still with a few issues:
- Missing the coin icons and tick symbols
- The prices are static and do not updates automatically like CMC does.
Let’s fix those.
Icons and Tickers
CoinMarketCap has the format: Icon Name Ticker as illustrated below.
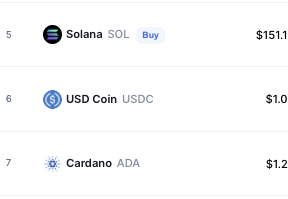
I found a free library of all the major crypto icons on http://cryptoicons.co/ and downloaded them to “images/icons” folder.
Next, we need to use phpGrid custom formatter.
phpGrid Custom formatter
This is section is the most crucial. It’s what really makes our cloned table “shine”. Custom formatter in phpGrid is a super powerful and versatile function for manipulating, modifying, or even adding additional information in a single column in grid. You can learn more about it on custom formatter online documentation.
I’m adding custom formatter to the followings:
- Name (with icon & ticker)
- Price
- 24h change (%)
- 7day change (%)
- Volume with dollar amount
- Circulating supply with % bar
PHP
1 2 3 4 5 | $dg->set_col_property('Name', array('formatter'=>'###nameFormatter###')); // must have ### $dg->set_col_property('Volume24H', array('formatter'=>'###volumeFormatter###')); // must have ### $dg->set_col_property('CirculatingSupply', array('formatter'=>'###circulatingSupplyFormatter###')); // must have ### $dg->set_col_property('Percentage24H', array('formatter'=>'###percentageChangeFormatter###')); // must have ### $dg->set_col_property('Percentage7D', array('formatter'=>'###percentageChangeFormatter###')); // must have ### |
Javascript (app.js)
1
2
3
4
5
6
7
8
9
10
11
12
13
14
15
16
17
18
19
20
21
22
23
24
25
function percentageChangeFormatter (cellValue, options, rowData) {
if (cellValue==0) return 'N/A';
return (cellValue.indexOf('-') >= 0) ? `<span style="color:red">${cellValue}</span&>`: `<span style="color:green">${cellValue}</span>`;
}
function volumeFormatter (cellValue, options, rowData){
if (cellValue==0) return 'N/A';
let volume24hTotalCoin = parseInt(rowData['Volume24H']/rowData['Price']);
return `${rowData['Volume24H'].toLocaleString(undefined,{})} <span class="volume24hTotalCoin">${volume24hTotalCoin.toLocaleString(undefined,{})} ${rowData['Coin']}</span>`;
}
function circulatingSupplyFormatter (cellValue, options, rowData){
if (cellValue==0) return 'N/A';
let volume24hTotalCoin = parseInt(rowData['Volume24H']/rowData['Price']);
if (!!rowData['MaxSupply']) {
const percentageOfMaxSupply = parseInt((cellValue/rowData['MaxSupply']) * 100);
return `<span class="circulating-supply"${cellValue.toLocaleString(undefined ${rowData['Coin']}</span>` + `<div width="160" class="maxsupply-bar" title="Percentage: ${percentageOfMaxSupply}% of Max Supply of ${rowData['MaxSupply']}"><div style="width:${percentageOfMaxSupply}px" class="percentage-of-maxsupply"></div></div>`;
}
return `${cellValue.toLocaleString(undefined,{})}`;
}
1 2 3 4 5 6 7 8 9 10 11 12 13 14 15 16 17 18 19 20 21 22 23 24 25 | function percentageChangeFormatter (cellValue, options, rowData) { if (cellValue==0) return 'N/A'; return (cellValue.indexOf('-') >= 0) ? `<span style="color:red">${cellValue}</span&>`: `<span style="color:green">${cellValue}</span>`; } function volumeFormatter (cellValue, options, rowData){ if (cellValue==0) return 'N/A'; let volume24hTotalCoin = parseInt(rowData['Volume24H']/rowData['Price']); return `${rowData['Volume24H'].toLocaleString(undefined,{})} <span class="volume24hTotalCoin">${volume24hTotalCoin.toLocaleString(undefined,{})} ${rowData['Coin']}</span>`; } function circulatingSupplyFormatter (cellValue, options, rowData){ if (cellValue==0) return 'N/A'; let volume24hTotalCoin = parseInt(rowData['Volume24H']/rowData['Price']); if (!!rowData['MaxSupply']) { const percentageOfMaxSupply = parseInt((cellValue/rowData['MaxSupply']) * 100); return `<span class="circulating-supply"${cellValue.toLocaleString(undefined ${rowData['Coin']}</span>` + `<div width="160" class="maxsupply-bar" title="Percentage: ${percentageOfMaxSupply}% of Max Supply of ${rowData['MaxSupply']}"><div style="width:${percentageOfMaxSupply}px" class="percentage-of-maxsupply"></div></div>`; } return `${cellValue.toLocaleString(undefined,{})}`; } |
It looks pretty good!
Real-Time Data via Binance WebSocket
Last but not least, the data must be updated in real-time, similar to CoinMarketCap or CoinGecko, without requiring the entire page to be refreshed. For this experiment, I want the price to tick in the same way as CMC does.
WebSocket is supported by all major web browsers, with the exception of Opera Mini, according to caniuse.com. I was concerned that it would be a huge undertaking. As a result, I pushed this to the bottom of my to-do list. Fortunately, this was not the case. Binance’s websocket trade stream API made it simple.
1 2 3 4 5 6 7 8 9 10 11 | // real time data via Websocket $(document).ready(function(){ let coins = ['BTC', 'ETH', 'BNB', 'USDT', 'SOL', 'ADA', 'XRP', 'DOT', 'USDC', 'DOGE']; coins.forEach(function(coin){ var wss = new WebSocket(`wss://stream.binance.com:9443/ws/${coin.toLowerCase()}usdt@trade`); wss.onmessage = function (event) { var messageObject = JSON.parse(event.data) $("#CoinMarket").jqGrid("setCell", coin, "Price" ,(messageObject.p)); } }) }) |
From its API, there are tons of great data can be consumed. For our purpose, we will only need messageObject.p, which returns ‘Order Price’.
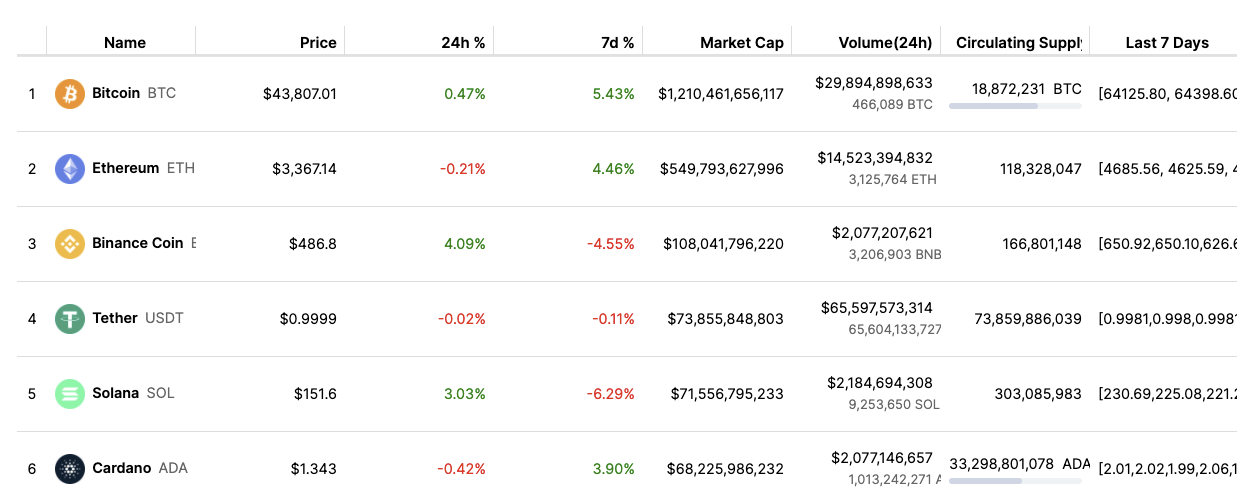
Bonus: Adding Sparkline Chart of “last 7 days”
On the coin market cap, todays’ cryptocurrency price table also features a lovely “mini” line chart for column “last 7 days”. The name for the type of chart is “sparkline”, and it is typically drawn without axes or coordinates. I wonder if it’s possible to include that.
It turns out jQuery already has a Sparkline plugin. It takes a simple array of numbers. For example:
1 | "Last7Days”: "[64125.80, 64398.60, 64134.50, 64806.70, 64932.60, 66904.40, 67527.90]” |
call to the sparkline() function to display the sparkline
1 | $('.sparklines').sparkline('html', { enableTagOptions: true, fillColor:false, lineWidth:2, width:'100%', height:'50px' }); |
remember include Sparkline plugin before </body>
1 | <script src="https://cdnjs.cloudflare.com/ajax/libs/jquery-sparklines/2.1.2/jquery.sparkline.min.js" type="text/javascript"></script> |
The Final Outcome of CoinMarketCap.com Clone
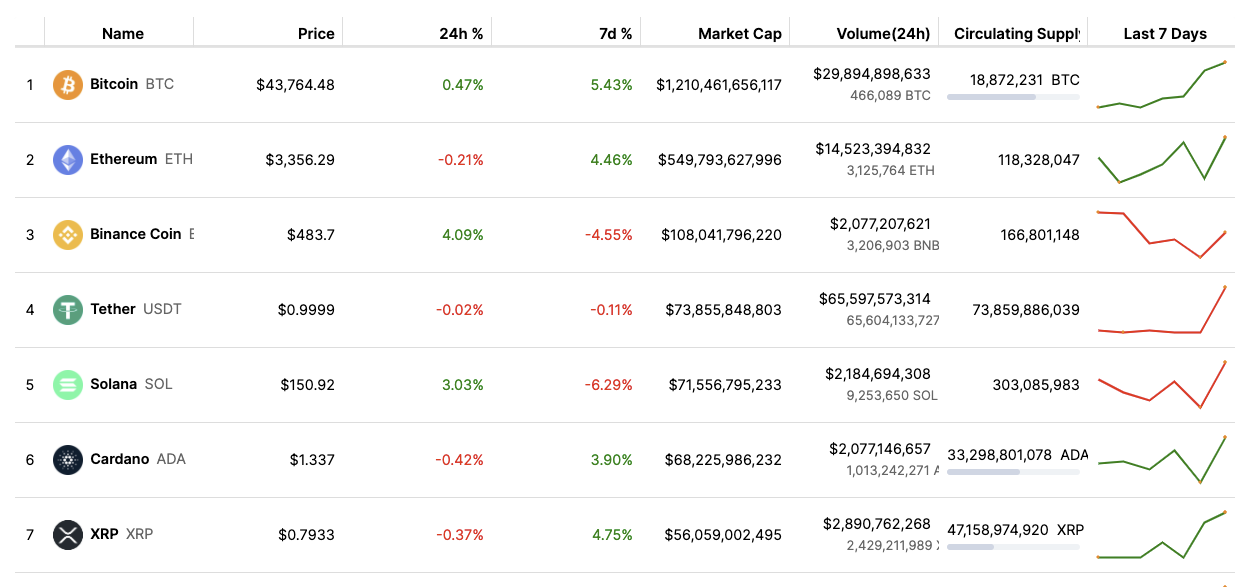
Not too shabby!
Summary
Our little CMC cryptocurrency price chart looks darn good. Considering how little code it took. It uses custom formatter for most of the ‘fancy’ stuffs such as tickers and icons. WebSocket is definitely something very exciting to show live data stream.
Potential Enhancements
This is a fun experiment to really push the envelop with phpGrid beyond common use cases such as inventory management, CRM, timesheet applications.
Some potential useful enhancements:
- Interactive cryptocurrency market cap chart
- Pick and choose cryptocurrencies for display
- Filters
- Search
- Database to store price history